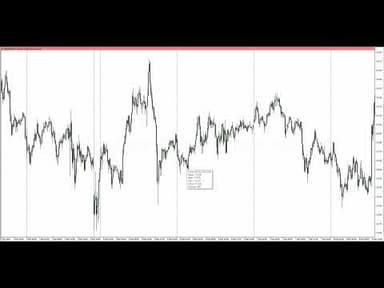
npL3ZXJ5zOU
43:35Open on YouTube ↗
AI summary of “npL3ZXJ5zOU”, generated by Sumvid.
Title
Mastering Liquidity Concepts: Trading Low-Resistance Liquidity Runs Using Higher Timeframe Analysis
One-Sentence Summary
This module teaches traders how to identify and trade low-resistance liquidity runs by analyzing external and internal range liquidity on higher timeframes (monthly/weekly) and aligning lower timeframe entries with institutional order flow direction.
Key Takeaways
- [0:36] External range liquidity exists above the range high (buy side) and below the range low (sell side), while internal range liquidity refers to price action within an established trading range; understanding this distinction is crucial for identifying entry and exit points.
- [1:42] Gap risk occurs when markets quickly reprice to levels with little or no prior trading activity, often creating stop-outs for traders; identifying these gaps and fair value gaps on higher timeframes helps predict where price will likely fill or consolidate.
- [3:15] Order blocks and market maker buy/sell models form inside trading ranges; traders should look for previous highs and lows to anticipate liquidity runs and identify where institutional orders cluster.
- [12:05] Low-resistance liquidity runs occur when trading on lower timeframes (daily, 4-hour, 1-hour) is aligned with the bullish or bearish bias established on higher timeframes (monthly, weekly), resulting in price moving through levels with minimal friction.
- [22:28] Traders should focus on finding approximately one high-probability setup per week rather than forcing trades on every timeframe; selectivity improves trade quality and reduces unnecessary risk exposure.
- [32:21] Establish directional bias from monthly or weekly charts first, then use lower timeframes to identify bullish order blocks or entry points that align with that bias; this framework ensures trades move with institutional money and institutional order flow.
- [40:09] Different profit objectives require different timeframe strategies: for 100+ pips weekly, trade 4-hour or 1-hour charts; for smaller daily objectives, 15-minute to hourly charts work better; matching your model to your timeframe is essential for consistent execution.
Suggested Category Tags
Trading Strategy, Market Liquidity Analysis, Institutional Order Flow, Price Action Trading, Forex Education
Want a summary like this for your own video?
Summarize your own video — free