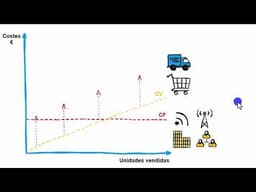
Fixed vs. Variable Costs Explained with a Graph
AI summary of “Fixed vs. Variable Costs Explained with a Graph” by Carlos Albert Magro, generated by Sumvid.
Title
Fixed vs. Variable Costs Explained with a Graph
One-Sentence Summary
The video uses a simple cost-volume graph to define fixed costs (which stay the same regardless of units sold) and variable costs (which rise in proportion to sales), then shows how adding them together produces the total cost line.
Worth Watching If
You are new to business or cost accounting and want a quick, visual introduction to cost behavior in under three minutes. It is a basic primer with no numerical example, so it will not help anyone who already understands these concepts.
Chapters
- [0:01] Introduces the graph: euros on the vertical axis and units sold on the horizontal axis.
- [0:32] Defines fixed costs, which stay constant whether or not anything sells, with examples such as internet/WiFi, office rent, utilities, and administrative staff.
- [1:03] Defines variable costs, which rise in proportion to sales and are zero when no units are sold.
- [2:04] Stacks the variable cost line on top of the fixed cost line to produce a total cost line, the sum of all costs.
Key Takeaways
- [0:01] The graph plots costs in euros on the vertical axis against units sold on the horizontal axis.
- [0:32] Fixed costs stay the same or nearly the same regardless of sales volume. The speaker's examples are internet/WiFi, office rent, energy and utility bills, and administrative or support staff salaries.
- [1:03] Variable costs increase proportionally as sales increase, and there are none when no units have been produced or sold.
- [1:34] The speaker gives raw materials or purchased merchandise and transport of those goods as examples of variable costs, since more sales require more product and more shipping.
- [2:04] Total costs are the sum of fixed and variable costs. On the graph, the variable cost line is shifted up above the fixed cost line, and the resulting line represents total costs.
Action Items
- Go through your own expenses and label each one as fixed (rent, subscriptions, salaries) or variable (materials, packaging, shipping, sales commissions).
- Sketch the graph yourself: draw a flat fixed-cost line, then a variable-cost line starting at zero and rising, and add them to get the total-cost line.
Suggested Category Tags
More from Carlos Albert Magro
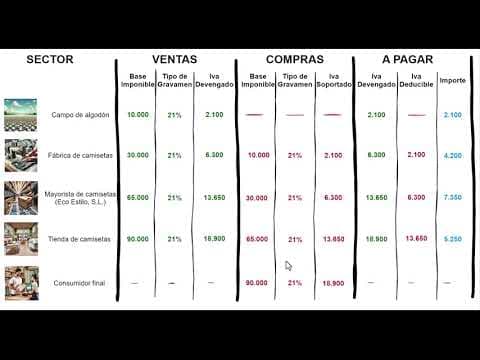
How VAT Works: Tracing the Tax from Cotton Field to Consumer
Carlos Albert Magro
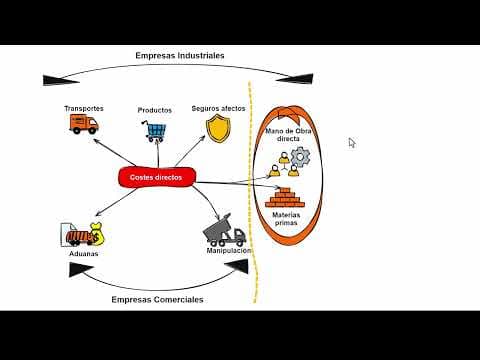
Direct vs. Indirect Costs: Key Differences for Businesses
Carlos Albert Magro
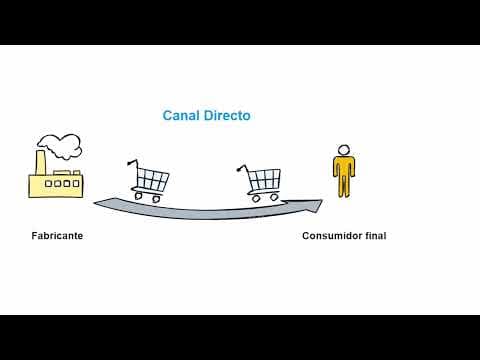
Direct vs. Indirect Distribution Channels in Marketing
Carlos Albert Magro
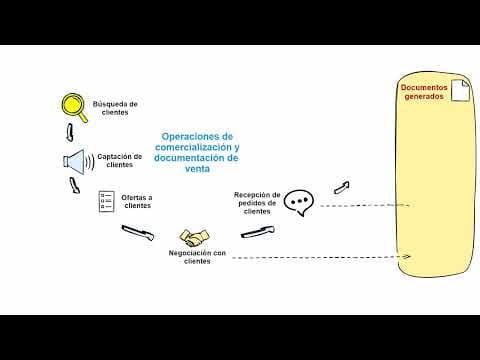
The Sales Process: Phases and Documentation in Commercial Operations
Carlos Albert Magro
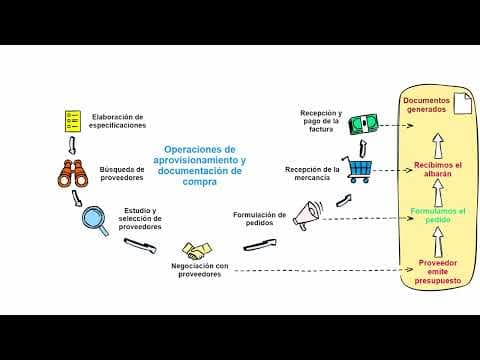
The Business Procurement Process: From Specifications to Payment
Carlos Albert Magro
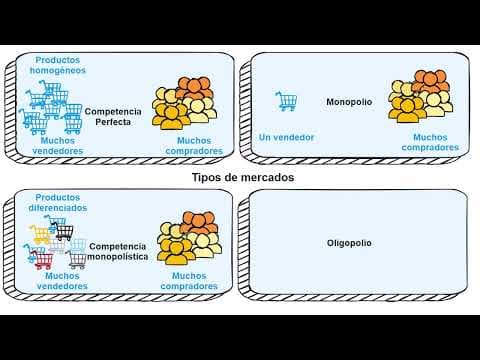
Types of Market Structures: From Perfect Competition to Oligopoly
Carlos Albert Magro